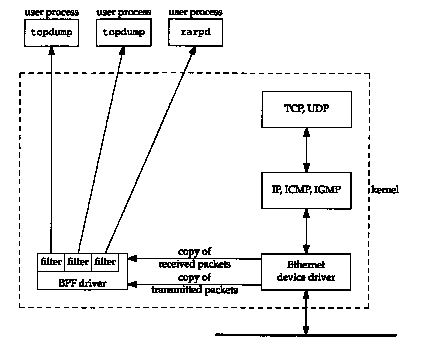
Figure A.1 BSD Packet Filter.
The tcpdump program was written by Van Jacobson, Craig Leres, and Steven McCanne, all of Lawrence Berkeley Laboratory, University of California, Berkeley. Version 2.2.1 (June 1992) is used in this text.
tcpdump operates by putting the network interface card into promiscuous mode so that every packet going across the wire is captured. Normally interface cards for media such as Ethernet only capture link level frames addressed to the particular interface or to the broadcast address (Section 2.2).
The underlying operating system must allow an interface to be put into promiscuous mode and let a user process capture the frames, tcpdump support is provided or can be added to the following Unix systems: 4.4BSD, BSD/386, SunOS, Ultrix, and HP-UX. Consult the README file that accompanies the tcpdump distribution for the details on what operating system and which versions are supported.
There are alternatives to tcpdump.
In Figure 10.8 we use the Solaris 2.2 program snoop to look at
some packets. AIX 3.2.2 provides the program iptrace,
which provides similar features.
A.1 BSD Packet Filter
Current BSD-derived kernels provide the BSD Packet Filter (BPF), which is one method used by tcpdump to capture and filter packets from a network interface that has been placed into promiscuous mode. BPF also works with point-to-point links, such as SLIP (Section 2.4), which require nothing special to capture all packets going through the interface, and with the loopback interface (Section 2.7).
BPF has a long history. The Enet packet filter was created in 1980 by Mike Accetta and Rick Rashid at Carnegie Mellon University. Jeffrey Mogul at Stanford ported the code to BSD and continued its development from 1983 on. Since then, it has evolved into the Ultrix Packet Filter at DEC, a STREAMS NIT module under SunOS 4.1, and BPF. Steven McCanne, of Lawrence Berkeley Laboratory, implemented BPF in Summer 1990. Much of the design is from Van Jacobson. Details of the latest version, and a comparison with Sun's NIT, are given in [McCanne and Jacobson 1993].
Figure A.1 shows the features of BPF when used with an Ethernet.

BPF places the Ethernet device driver into promiscuous mode and then receives a copy from the driver of each received packet and each transmitted packet. These packets are run through a user-specified filter, so that only packets that the user process considers interesting are passed to the process.
Multiple processes can be monitoring a given interface, and each process specifies its own filter. Figure A.1 shows two instances of tcpdump and an RARP daemon (Section 5.4) both monitoring the same Ethernet. Each instance of tcpdump specifies its own filter. The filter for tcpdump can be specified by the user on the command line, while rarpd always uses the same filter to capture only RARP requests. '
In addition to specifying a filter, each user of BPF also specifies a timeout value. Since the data rate of the network can easily outrun the processing power of the CPU, and since it's costly for a user process to issue small reads from the kernel, BPF tries to pack multiple frames into a single read buffer and return only when the buffer is full, or the user-specified timeout has expired, tcpdump sets the timeout to 1 second since it normally receives lots of data from BPF, while the RARP daemon receives few frames, so rarpd sets the timeout to 0 (which returns when a frame is received).
The user-specified filter to tell BPF what frames the process considers interesting is a list of instructions for a hypothetical machine. These instructions are interpreted by the BPF filter in the kernel. Filtering in the kernel, and not in the user process, reduces the amount of data that must pass from the kernel to the user process. The RARP daemon always uses the same filter program, which is built into the program, tcpdump, on the other hand, lets the user specify a filter expression on the command line each time it's run. tcpdump converts the user-specified expression into the corresponding sequence of instructions for BPF. Examples of the tcpdump expressions are:
% tcpdump tcp port 25
% tcpdump 'icmp[0]
!= 8 and icmp[0] <= 0'
The first prints only TCP segments with a source or destination port of 25. The second prints only ICMP messages that are not echo requests or echo replies (i.e., not ping packets). This expression specifies that the first byte of the ICMP message, the type field from Figure 6.2, not equal 8 or 0, an echo request or echo reply from Figure 6.3. As you can see, fancy filtering requires knowledge of the underlying packet structure. The expression in the second example has been placed in single quotes to prevent the Unix shell from interpreting the special characters.
Refer to the tcpdump(l)
manual page for complete details of the expression that the user
can specify. The bpf(4) manual page
details the hypothetical machine instructions used by BPF. [McCanne
and Jacobson 1993] compare the design and performance of this
machine against other approaches.
A.2 SunOS Network Interface Tap
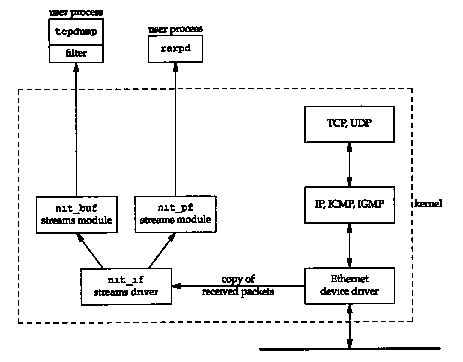
SunOS 4.1.x provides a STREAMS pseudo-device driver called the Network Interface Tap or NIT. ([Rago 1993] contains additional details on streams device drivers. We'll call the feature "streams.") NIT is similar to the BSD Packet Filter, but not as powerful or as efficient. Figure A.2 shows the streams modules involved in using NIT. One difference between this figure and Figure A.1 is that BPF can capture packets received from and transmitted through the network interface, while NIT only captures packets received from the interface. Using tcpdump with NIT means we only see packets sent by other hosts on the network-we never see packets transmitted by our own host. (Although BPF works with SunOS 4.1.x, it requires source code changes to the Ethernet device driver, which are impossible for most users who don't have access to the source code.)
When the device /dev/nit is opened, the streams driver nit_if is opened. Since NIT is built using streams, processing modules can be pushed on top of the nit_if driver, tcpdump pushes the module nit_buf onto the STREAM. This module aggregates multiple network frames into a single read buffer, with the user process specifying a timeout value. This is similar to what we described with BPF. The RARP daemon doesn't push this module onto its stream, since it deals with a low volume of packets.

The user-specified filtering is done by the streams
module nit_pf. Notice in Figure A.2
that this module is used by the RARP daemon, but not by tcpdump.
Instead, under SunOS tcpdump performs
its own filtering in the user process. The reason is that the
hypothetical machine instructions used by nit_pf
are different (and not as powerful) as those supported by BPF.
This means that when the user specifies a filter expression to
tcpdump more data crosses the kernel-to-user
boundary with NIT than with BPF.
A.3 SVR4 Data Link Provider Interface
SVR4 supports the Data Link Provider Interface (DLPI) which is a streams implementation of the OSI Data Link Service Definition. Most versions of SVR4 still support version 1 of the DLPI, SVR4.2 supports both versions 1 and 2, and Sun's Solaris 2.x supports version 2, with additional enhancements.
Network monitoring programs such as tcpdump must use the DLPI for raw access to the data-link device drivers. In Solaris 2.x the packet filter streams module has been renamed pfmod and the buffer module has been renamed bufmod.
Although Solaris 2.x is still new, an implementation
of tcpdump should appear someday.
Sun also supplies a program named snoop that performs functions
similar to tcpdump. (snoop replaces
the SunOS 4.x program named etherfind.)
The author is not aware of any port of tcpdump
to vanilla SVR4.
A.4 tcpdump Output
The output produced by tcpdump is "raw." We'll modify it for inclusion in the text to make it easier to read.
First, it always outputs the name of the network interface on which it is listening. We'll delete this line.
Next, the timestamp output by tcpdump is of the form 09:11:22.642008 on a system with microsecond resolution, or 09:11:22.64 on a system with only 10-ms clock resolution. (In Appendix B we talk more about computer clock resolution.) In either case the HH:MM:SS format is not what we want. Instead we are interested in both the relative time of each packet from the start of the dump, and the time difference between successive packets. We'll modify the output to show these two differences. The first difference we print with six digits to the right of the decimal point when microsecond resolution is available (two digits when only 10-ms resolution is provided), and the second difference we print with either four digits or two digits to the right of the decimal point (depending on the clock resolution).
In this text most tcpdump output was collected on the host sun, which provides microsecond resolution. Some output was collected on the host bsdi running BSD/386 Version 0.9.4, which only provided 10-ms resolution (e.g.. Figure 5.1). Some output was also collected on bsdi when it was running BSD/386 Version 1.0, which provides microsecond resolution.
tcpdump always prints the name of the sending host, then a greater than sign, then the name of the destination host. This makes it hard to follow the flow of packets between two hosts. Although our tcpdump output will still show the direction of data flow like this, we'll often take this output and produce a time line instead. (The first of these in the text is Figure 6.11.) In our time lines one host will be on the left, and the other on the right. This makes it easier to see which side sends and which side receives each packet.
We add line numbers to the tcpdump output, allowing us to reference specific lines in the text. We also add additional space between certain lines, to separate some packet exchanges.
Finally, tcpdump output can exceed the width of the page. We wrap long lines around at convenient points in the line.
As an example, the output produced by tcpdump corresponding to Figure 4.4 is shown in Figure A.3, assuming an 80-column terminal window.
We won't show our typing the interrupt key (which terminates tcpdump) and we won't show the number of packets received and dropped. (Dropped packets are those that arrived faster than tcpdump could keep up with. Since the examples in the text were often run on an otherwise idle network, this is always 0.)
| sun % tcpdump -e | |
| tcpdump: listening on le0 | |
| 09:11:22.642008 0:0:c0:6f:2d:40 ff:ff:f f:ff:ff:ff arp 60: arp who-has svr4 tell bsdi | |
| 09:11:22.644182 0;0:c0:c2:9b:26 0:0:c0:6f:2d:40 arp 60: arp reply svr4 is-at 0:0:c0:c2:9b:26 | |
| 09:11:22.644839 0:0:c0:6f:2d:40 0:0:c0:c2:9b:26 ip 60: bsdi.1030 > svr4.discard: S 596459521:596459521(0) win 4096 <mss 1024> [tos 0x10] | |
| 09:11:22.649842 0:0:c0:c2:9b:26 0:0:c0:6f:2d:40 ip 60: svr4.discard > bsdi.1030: S 3562228225:3562228225(0) ack 596459522 win 4096 <mss 1024> | |
| 09:11:22.651623 0:0:c0:6f:2d:40 0:0:c0:c2:9b:26 ip 60: bsdi.1030 > svr4.discard: . ack 1 win 4096 [tos 0x10] | |
| 4 other packets that we don't show | |
| ^? | type our interrupt key to terminate |
| 9 packets received by filter | |
| 0 packets dropped by kernel | |
It should be obvious that tapping into a network's traffic lets you see many things you shouldn't see. For example, the passwords typed by users of applications such as Telnet and FTP are transmitted across the network exactly as the user enters them. (This is called the cleartext representation of the password, in comparison to the encrypted representation. It is the encrypted representation that is stored in the Unix password file, normally /etc/passwd or /etc/shadow.) Nevertheless, there are many times when a network administrator needs to use a tool such as tcpdump to diagnose network problems.
Our use of tcpdump is
as a learning tool, to see what really gets transmitted across
the network. Access to tcpdump, and
similar vendor-supplied utilities, depends on the system. Under
SunOS, for example, access to the NIT device is restricted to
the superuser. The BSD Packet Filter uses a different technique:
access is controlled by the permissions on the devices /dev/bpfXX.
Normally these devices are readable and writable only by the owner
(which should be the superuser) and readable by the group (often
the system administration group). This means normal users can't
run programs such as tcpdump, unless
the system administrator makes the program set-user-ID.
A.6 Socket Debug Option
Another way to see what's going on with a TCP connection is to enable socket debugging, on systems that support this feature. This feature works only with TCP (not with other protocols) and requires application support (to enable a socket option when it's started).
Most Berkeley-derived implementations support this, including SunOS, 4.4BSD, and SVR4.
The program enables a socket option, and the kernel then keeps a trace record of what happens on that connection. At some later time all this information can be output by running the program trpt(8). It doesn't require special permission to enable the socket debug option, but it requires special privileges to run trpt, since it accesses the kernel's memory.
Our sock program (Appendix C) supports this feature with its -D option, but the information output is harder to decipher and understand than the corresponding tcpdump output. We do, however, use it in Section 21.4 to look at kernel variables in the TCP connection block that tcpdump cannot access.